Data analysis
WordPress TTFB: One in Four WordPress Sites Takes Over 1.8 Seconds to Respond
Published by Christian Schreiber · 8 min read
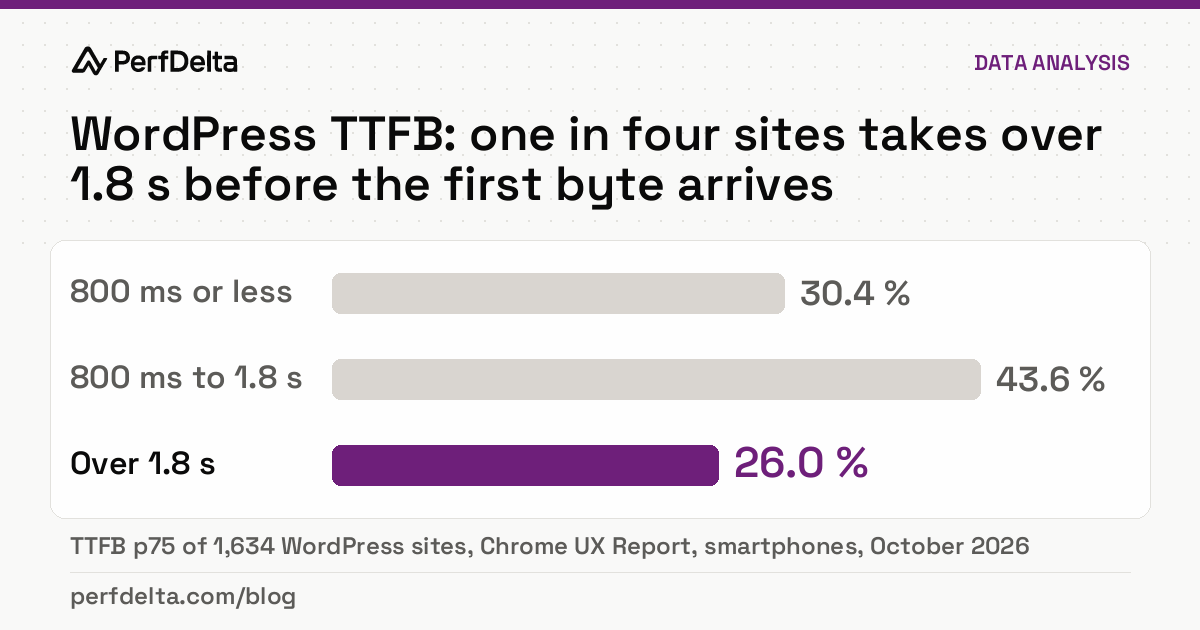
WordPress websites are usually blamed for too many plugins and heavy themes in the browser. Our field data points somewhere else: the server. We looked at the Chrome field data of 1,634 WordPress websites. On one in four, the 75th percentile of the Time to First Byte (TTFB) was above 1.8 seconds, the threshold Google rates as poor. Across all 11,376 websites in our sample with TTFB data, that applied to one in ten.
On these websites, at least one in four page views waits more than 1.8 seconds for the first byte of HTML. Nothing of the new page can appear before that, and no image optimization or script deferral can recover that time within the same page load.
TTFB is the time until the first byte of the HTML arrives
The Time to First Byte measures how long it takes from the start of a navigation until the first byte of the response reaches the browser. According to Google, it includes redirects, a possible service worker start, the DNS lookup, connection and TLS setup and the time the server needs to start answering (Time to First Byte, web.dev, last updated November 2025). Google considers 0.8 seconds or less good and more than 1.8 seconds poor.
Think of a restaurant. The TTFB is the time from ordering until the first plate leaves the kitchen. If the kitchen cooks every dish from scratch, the fastest waiter will not help. A page cache is the dish that is already prepared.
The TTFB is not a Core Web Vital itself, but it is the first part of the Largest Contentful Paint (LCP). Every millisecond the server needs delays the LCP. Our guide to the time to first byte explains the metric in detail.
WordPress websites have a slower TTFB than the rest of the sample
The table compares the WordPress websites with all websites in our sample. The values are based on the 75th percentile (p75) of real smartphone visits from the Chrome UX Report. The first row is the median of the p75 values of all websites, the other rows show the share of websites whose p75 is in the given range:
| Smartphone field data | WordPress | All websites |
|---|---|---|
| TTFB, median of the p75 values | 1,158 ms | 841 ms |
| Good TTFB (0.8 s or less) | 30.4 % | 46.8 % |
| Poor TTFB (over 1.8 s) | 26.0 % | 10.4 % |
| Good LCP (2.5 s or less) | 48.4 % | 59.0 % |
| Good INP (200 ms or less) | 71.7 % | 60.2 % |
| Good CLS (0.1 or less) | 82.8 % | 76.6 % |
| All three Core Web Vitals good | 34.5 % | 36.4 % |
WordPress websites do better than average on interactivity (INP) and layout stability (CLS). They lose on loading speed, and the loss starts at the server.
Server response is the longest LCP phase on 62 percent of slow WordPress sites
CrUX splits the LCP into four phases: the TTFB, the delay until the LCP image starts loading, its download and the time until it is rendered. It reports these phases only for page views where the LCP element is an image. For the 829 WordPress websites with an LCP p75 above 2.5 seconds and phase data, we checked which phase had the highest p75:
| Phase with the highest p75 | WordPress | All websites |
|---|---|---|
| Time to First Byte | 62.5 % | 44.5 % |
| Resource load delay | 29.4 % | 44.0 % |
| Element render delay | 7.2 % | 9.9 % |
| Resource load duration | 0.8 % | 1.5 % |
On these sites, the p75 of the TTFB phase was 1,732 ms (median across the sites). In the slowest quarter of page views, the server response alone takes up more than two thirds of the 2.5 second budget for a good LCP. Across all websites, load delay and server response share the lead almost equally, as our analysis of slow LCP causes showed. On WordPress, the server clearly dominates.
Missing page caching is a likely cause, the network explains little
The TTFB also contains the network. The data allows a rough check: the median round trip time (p75) of the WordPress websites was 142 ms, only 15 ms above the 127 ms of all websites. Even with three to four round trips for DNS, connection and TLS, that explains a small part of the 317 ms gap in the median TTFB. Most of the difference has to come from the time the server needs to answer.
WordPress builds every page with PHP and database queries unless a cache delivers a finished copy. A cached page often arrives in a few hundred milliseconds, an uncached one can take seconds on a busy server. If more than a quarter of page views miss the cache, the p75 is set by the uncached response time. Our data contains no cache information, so this is a likely explanation, not a measured one. Typical reasons for misses:
- No full page cache at all, or only a cache in the browser instead of on the server.
- Query parameters. Server and CDN caches with the default cache key treat
?utm_source=…,?gclid=…or?fbclid=…as a new page and build it from scratch. Visitors from ads and newsletters, often the most valuable ones, hit the slowest path. Several caching plugins already ignore these parameters. - Cookies. Logged-in users, shop carts and some consent tools set cookies that make the cache step aside for the rest of the visit.
- Short cache lifetimes and full purges after every small change, so that the cache is rarely warm on pages with little traffic.
Redirects add to this. A link to http:// or to the wrong host name, and click tracking redirects in front of a landing page, cost extra round trips before the real request starts. CrUX counts that time in the TTFB.
Six measures reduce the WordPress TTFB or its effect
- Serve HTML from a full page cache. At server level (for example Varnish or an nginx cache) or with a caching plugin. The WordPress handbook describes both and explains why a page cache has the largest effect (Cache, Advanced Administration Handbook). Check the hit rate in the response headers, such as
x-cache,ageorcf-cache-status. - Ignore marketing parameters in the cache key and keep cookies that bypass the cache to the pages that really need them, such as cart and checkout.
- Cache HTML at the edge. A CDN that stores the HTML close to the visitor removes the trip to the origin server and the server time for cached pages. Many CDNs, Cloudflare included, do not cache HTML by default. It needs an explicit cache rule with a cookie bypass and purging tied to WordPress. That matters most when the server is in Europe and the visitors are in the United States, or the other way round.
- Speed up uncached requests. A persistent object cache such as Redis or Memcached keeps database results between requests (same source). A current PHP version and a small set of autoloaded options reduce the work per page. Query Monitor shows slow database queries and hooks; a profiler such as Xdebug or SPX shows where PHP spends its time.
- Remove redirects and make the backend visible. Link to the final URL and use HSTS for the switch to HTTPS. A
Server-Timingheader shows in your own real user monitoring how much of the TTFB is spent in PHP and how much on the network. - Use the waiting time. With 103 Early Hints, the browser can start loading the stylesheet and the LCP image while the server is still building the page. Speculation Rules load the next page before the click. Since version 6.8, WordPress prefetches a linked page as soon as a visitor starts to click or tap it (conservative eagerness) (Speculative Loading in 6.8, Make WordPress Core, March 2025). With prerendering, the server response happens before the visitor clicks, and the TTFB of that page view is close to zero. On the median WordPress website in our sample, the share of prerendered page views was 0.0 percent.
Once the TTFB is under control, the next phase is the load delay of the LCP image. The guide to WordPress Core Web Vitals covers images, themes and plugins.
Test the TTFB of your WordPress site
The free TTFB test shows the field value of your page and your domain from the Chrome UX Report. The page speed test splits the LCP into its four phases for your website and your competitors. How WordPress websites perform overall is shown in the WordPress speed statistics.
Method and limits of this analysis
- Data: 11,396 smartphone records from the Chrome UX Report, each origin counted once, data period up to October 31, 2026, retrieved by PerfDelta. Each record covers a rolling 28-day window of real Chrome visits. TTFB values were available for 11,376 origins, 1,634 of them WordPress. Shares of good values refer to the origins with data for that metric.
- Platform: detected from the technology stack of the homepage in our latest measurement. The field data covers the whole origin.
- LCP phases: only origins with an LCP p75 above 2.5 seconds for which CrUX reports phase data. The phases cover only page views with an image as the LCP element. The longest phase is the phase with the highest p75. The p75 values of the four phases come from different page views and do not add up to the LCP p75.
- Correlation, not cause: the data describes websites that run on WordPress, including their hosting and cache setup. It does not show that WordPress itself is slow. A well cached WordPress site can deliver its HTML as fast as any other.
- Sample: the websites come from PerfDelta tests and studies and lean towards larger brands. The results are not representative of the entire web. More figures are in the website speed statistics.
